How do I see page performance reports?
As long as you have installed the standard Matomo tracker, Matomo will automatically try to track performance data for each page view when using the Matomo JavaScript tracker. The primary way to analyse your website speed is in the Performance report (available in Matomo version 4 and above) which can be found under the Behaviour section of the main navigation.
This section shows you how long it takes for all of the pages on your site to load and provides detailed analysis of which stages of the loading process contribute most to your site’s speed. As you can see in the example below, it also tracks how these metrics change over time, so you can avoid ever increasing load times and identify potential issues as they arise.

The top section of the Performance page displays a bar chart providing an overview of how your site is performing on the whole over the selected time period. You can change which dates are focused on through the standard Date Selector at the top of the page.

Below the performance chart you will find sparkline summary cards of your key performance metrics. Again, these metrics reflect the each metric averaged out across all of your pages within the currently selected time frame.

Page Performance Tables
Below the performance charts and sparkline summaries, you will find detailed performance metrics broken down for each individual page.
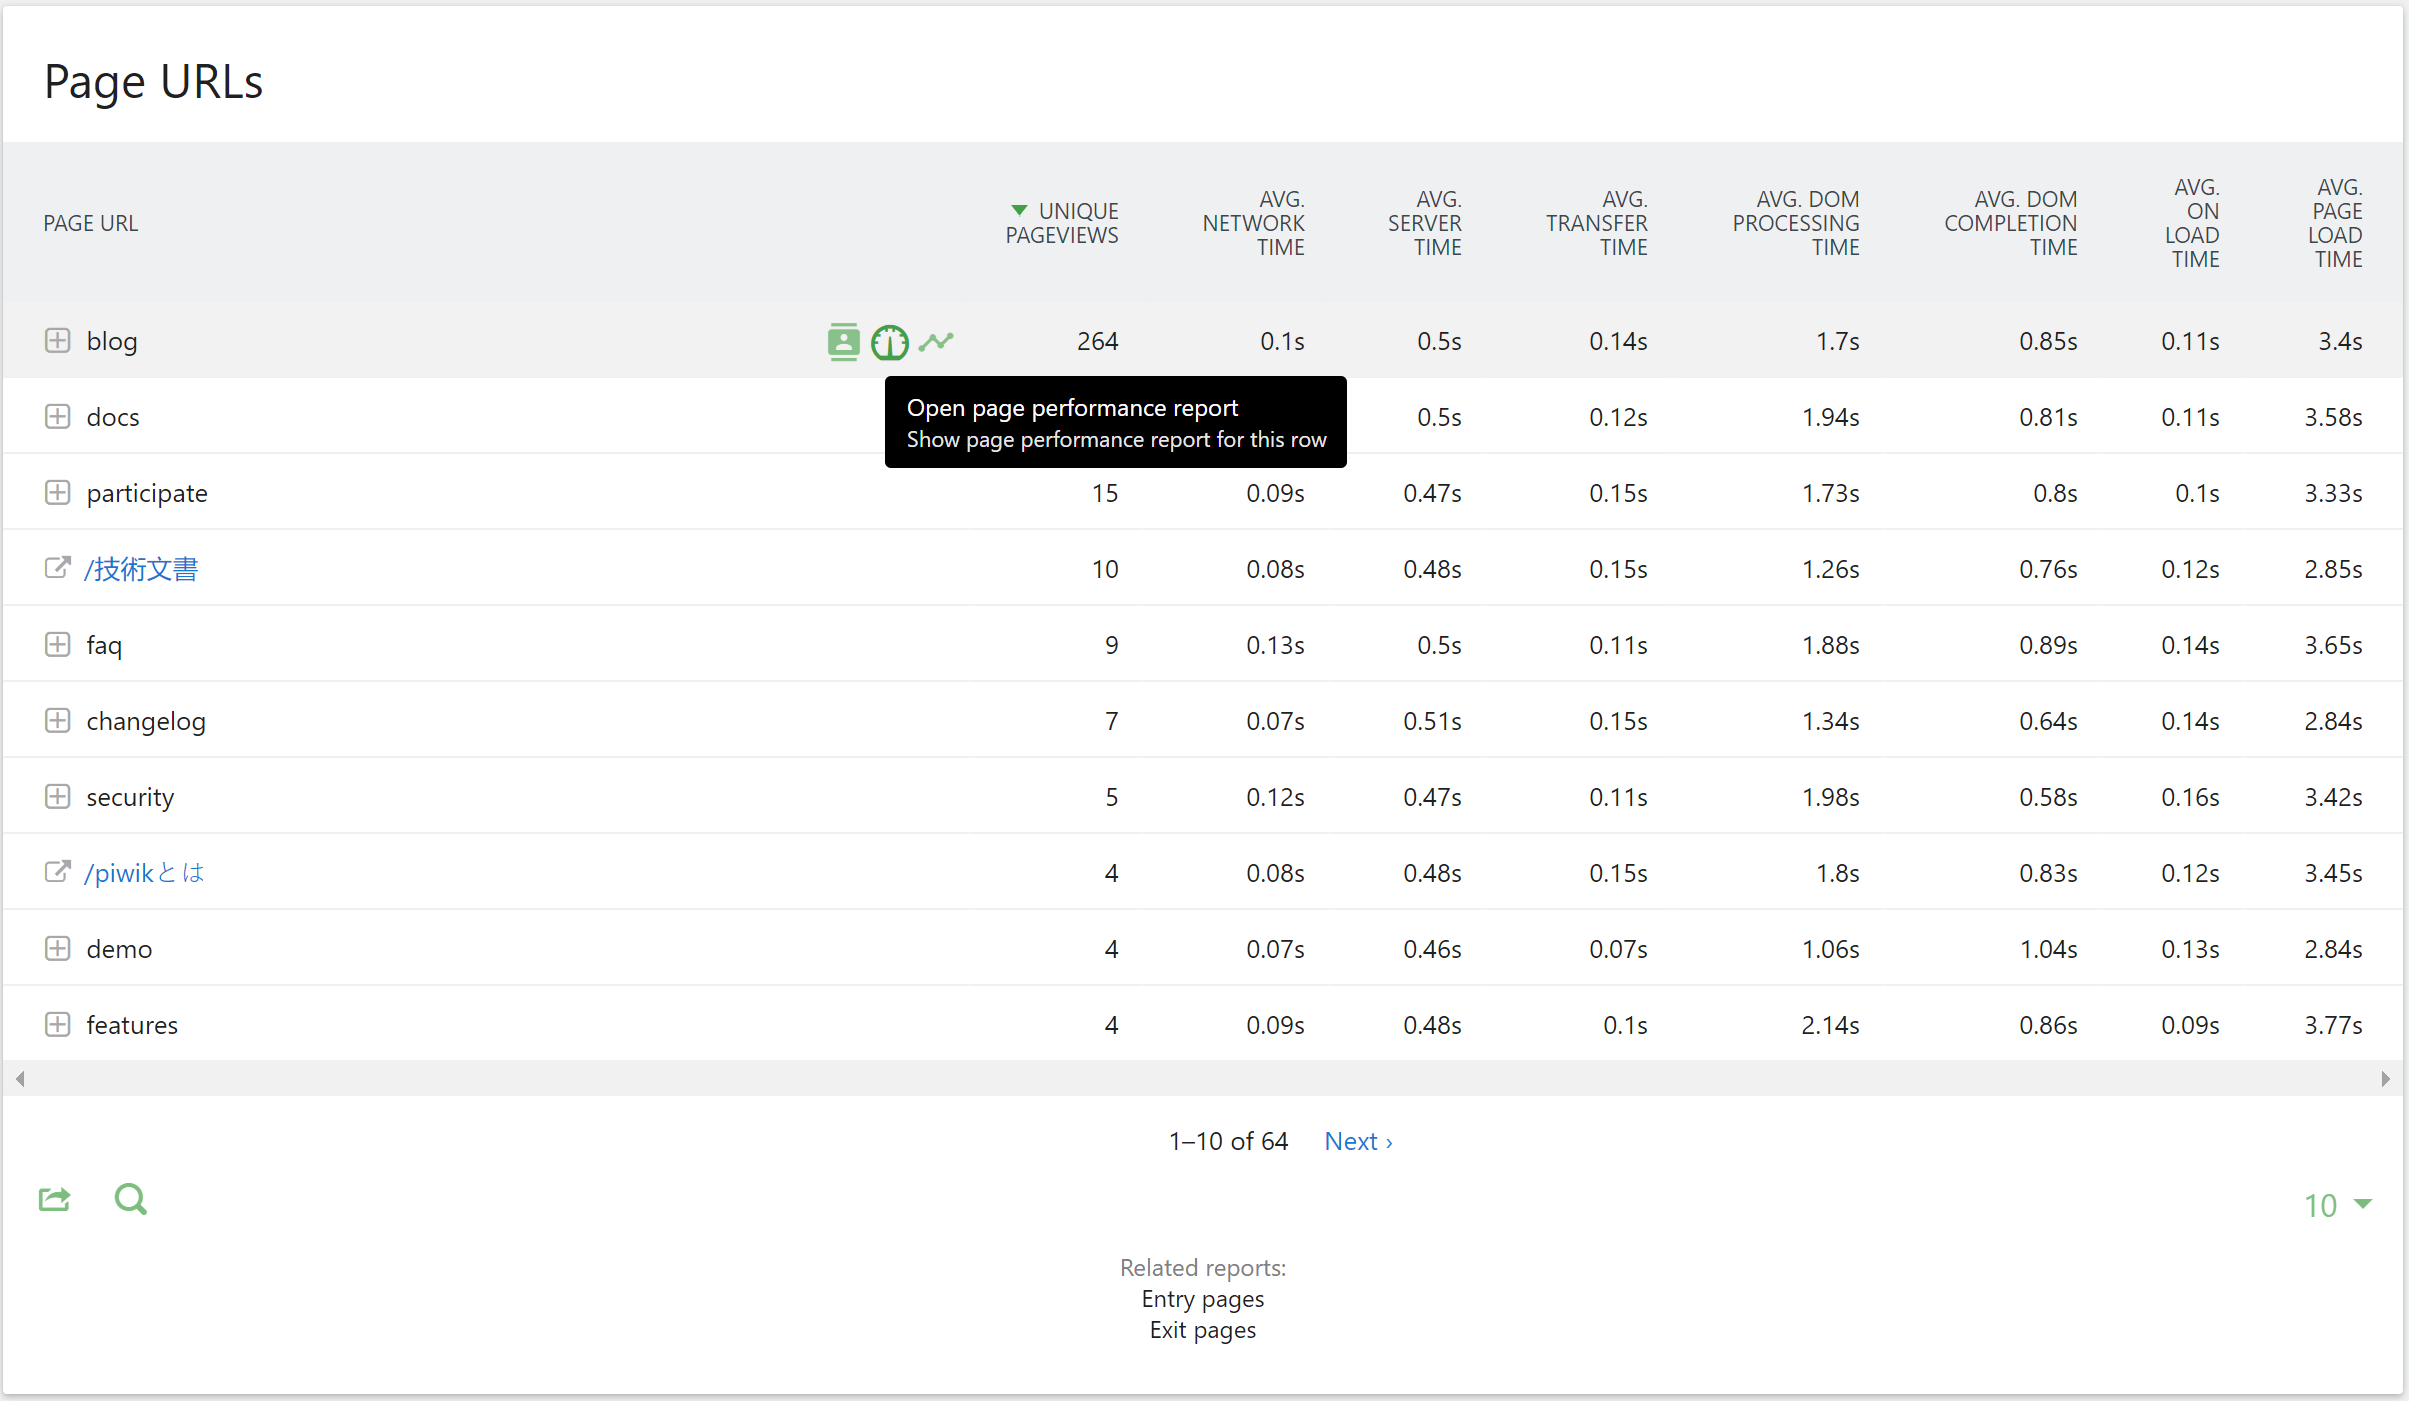
There are two different tables so you can review your page performance metrics broken down either by Page URLs or Page Titles depending on your site configuration and preference. One critical thing to remember is that while the specific performance metrics available within each of these tables are the same, the results may vary depending on your website configuration. For example the Page Titles report can include multiple pages with duplicate titles whereas the Page URL report should always account for a single page.
You’ll also find related report links at the bottom of each table if you would like to focus on either Entry or Exit pages. These related reports can be useful as slow load times are a common cause of high Bounce Rates and Exit Rates.

Access the Page Performance Report from any Page Table
While viewing one of the page reports, if you hover your mouse over one of the rows, you will see a series of green icons on that row. Clicking the Page Performance icon ![]() will take you to the page performance report for the selected page so you can track it over time.
will take you to the page performance report for the selected page so you can track it over time.

Along the bottom of the chart you will notice a calendar icon ![]() which allows you to choose the interval for the bar chart. You can view the page performance data grouped by days, weeks, months or years.
which allows you to choose the interval for the bar chart. You can view the page performance data grouped by days, weeks, months or years.
In the example screenshot above, you can see where an issue affecting the DOM processing time appeared on a specific day. The report was handed to a developer who recognised an error that was adding to the page load time and it was fixed by the next day.
Choosing an appropriate interval can help you to powerpoint where changes have occurred over time. In some cases, it may not be as obvious as the example above but if you have been making use of the Matomo annotations feature represented (annotation icon ![]() ), you might find that you’ve noted down specific changes on your site that coincide with a page speeding up or slowing down.
), you might find that you’ve noted down specific changes on your site that coincide with a page speeding up or slowing down.
One last note is that if a specific period stands out, you can hover your mouse over the bar to reveal a tooltip containing the specific date or dates covered by this period and exactly how long each part of the loading process contributed to the total.

Analyse the performance of specific pageviews
Whilst viewing the Visits Log, you can actually look at how long it took for any user to load a specific page. To see the page load time of each individual pageview, hover your mouse over the page URL for the visit you are interested in and the page load time is displayed within the tooltip that pops up.
